
Understanding the metrics that drive your e-commerce success is crucial, and one such metric that often goes under the radar is the Average Order Value (AOV). This figure is not just a number—it's a gateway to understanding your customers' purchasing behavior, whether they're first-time shoppers or loyal patrons returning for more. Let's dive into the intricacies of AOV, tackling its definition, and importance.
What is Average Order Value?
AOV is a critical e-commerce metric that measures the average amount spent each time a customer places an order on a website. It is calculated by dividing the total revenue by the number of orders over a specific period. A higher AOV indicates that customers are spending more per transaction, which can lead to increased revenue without necessarily increasing the number of customers.
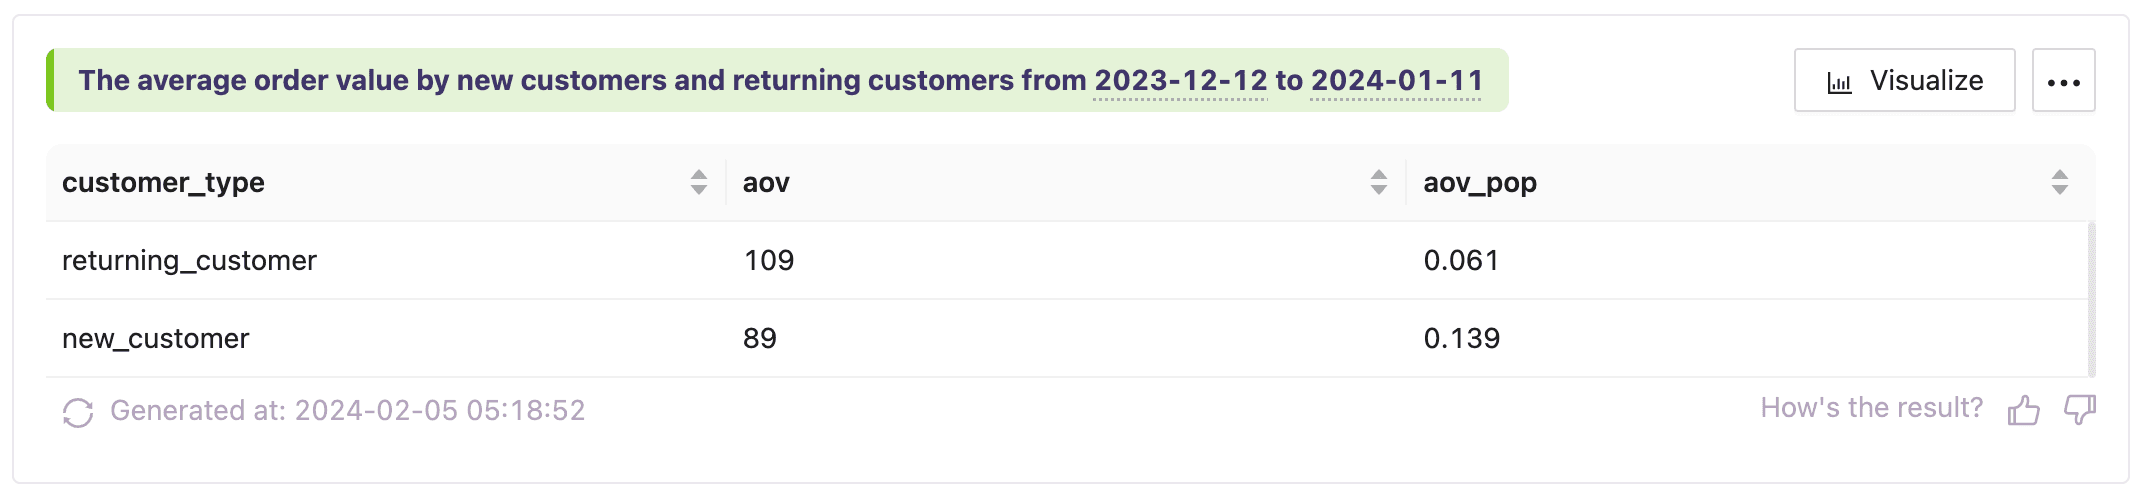
Tracking AOV in MagicBean
MagicBean offers robust analytics tools that allow businesses to track AOV by new and returning customers. By segmenting AOV, businesses can gain insights into their customer base, identifying which group tends to spend more and tailoring marketing strategies accordingly.
Calculating Average Order Value
Calculating AOV is straightforward:
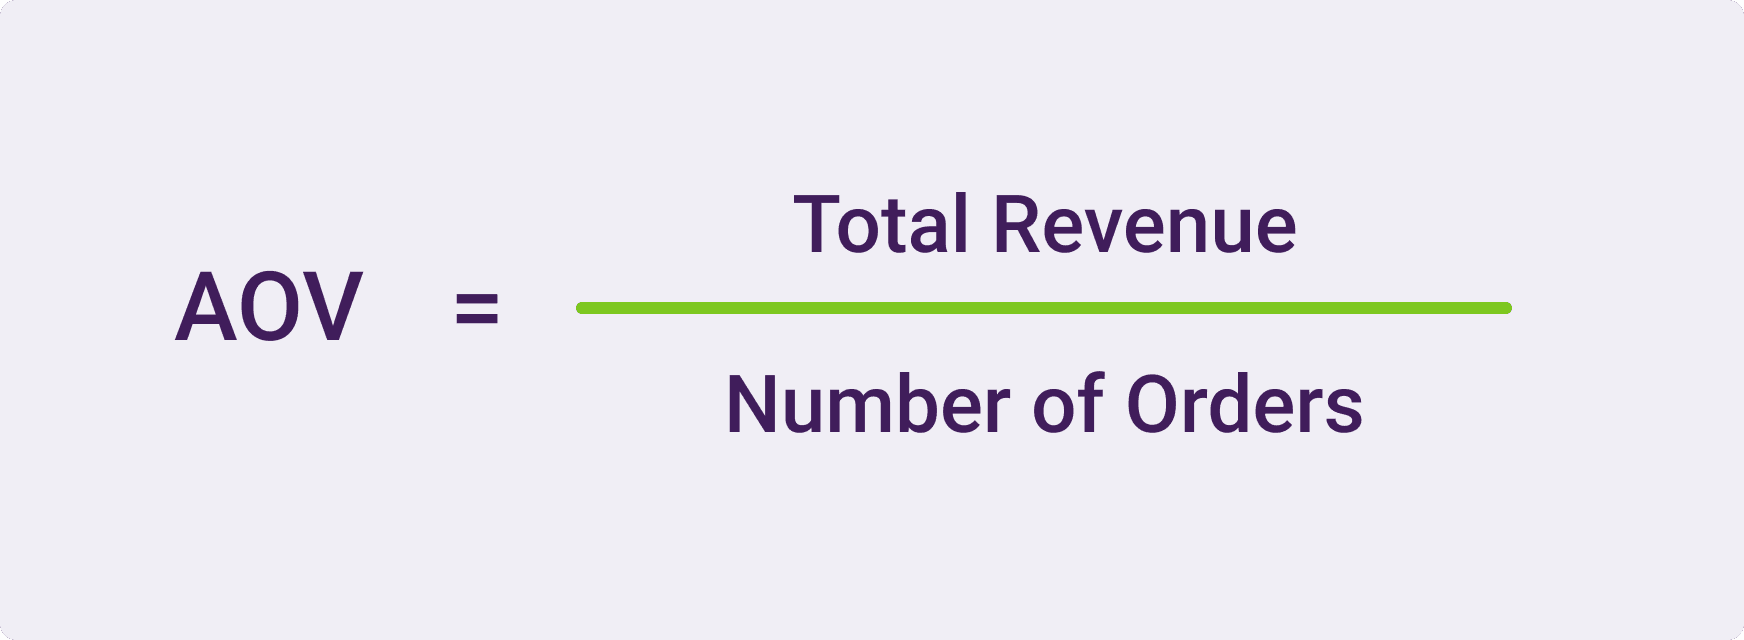
This formula can be applied universally, whether you're analyzing data for a brick-and-mortar store or an e-commerce platform like MagicBean.
What is a Good Percentage of New Customers?
A healthy percentage of new customers is indicative of growth and the effectiveness of your acquisition strategies. While the ideal rate varies by industry, a good benchmark is around 20% to 40% of your customer base being new. This range suggests that you're not only attracting new business but also maintaining a solid foundation of returning customers.
What is a Good Percentage of Returning Customers?
Returning customers are often seen as a barometer of your business's health and customer satisfaction. A good percentage of returning customers would be above 30%. This demonstrates that your product or service quality, customer service, and overall value proposition are strong enough to keep customers coming back.
Comparison Table: New vs. Returning Customers AOV
To provide a clearer picture, here's a comparison of AOV for new versus returning customers, including hypothetical data to illustrate how MagicBean can help businesses understand their customer dynamics.
| Customer Type | Average Order Value | Insights |
|---|---|---|
| New Customers | $50 | Indicates the initial trust and investment new customers are willing to make. |
| Returning Customers | $75 | Shows a higher willingness to spend, reflecting satisfaction and loyalty. |
This table exemplifies the potential difference in spending habits between new and returning customers, highlighting the importance of strategies tailored to each group to maximize AOV.
Conclusion
In the bustling world of e-commerce, leveraging data to drive strategic decisions is non-negotiable. Average Order Value is more than a metric; it's a lens through which businesses can view and understand customer behavior and preferences. For MagicBean users, the ability to segment AOV by new and returning customers provides a golden opportunity to refine marketing strategies, enhance customer experiences, and ultimately, drive revenue growth. By focusing on both attracting new customers and nurturing existing relationships, businesses can achieve a balanced and healthy customer base conducive to sustained success.
